What is the Charts chapter used for?
Proposal Kit Professional Bundle adds more design themes, all six Contract Packs,
a project management library, and Expert Edition software.

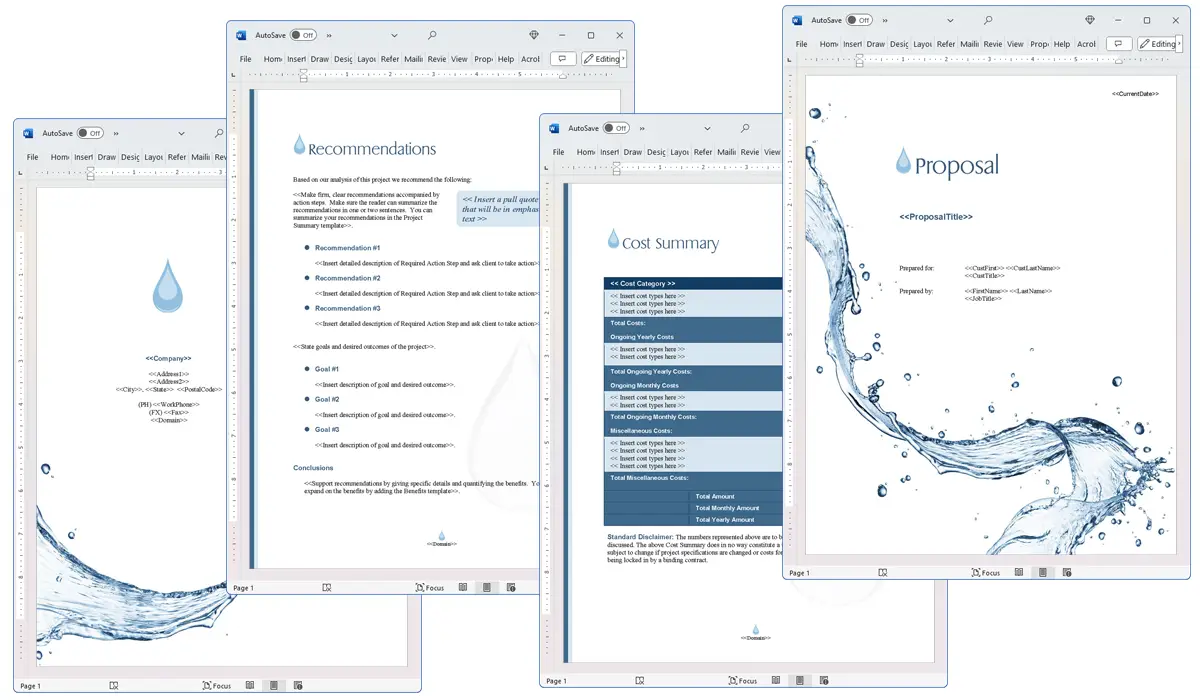
Illustration of Proposal Pack Aqua #5
We include this Charts chapter template in every Proposal Pack, along with thousands more. You assemble this chapter with others in various combinations to create custom-tailored business proposals, plans, reports, and other documents. Proposal Packs apply custom visual designs to the templates, giving the final documents a consistent professional finish.
 DOWNLOADABLE, ONE-TIME COST, NO SUBSCRIPTION FEES
Overview of the Charts Chapter
In the business world, clarity and precision are paramount, especially when presenting complex information. The Charts chapter template from Proposal Kit serves as a vital tool for achieving this clarity. This template helps in outlining and detailing the visual representation of data which is crucial for any project proposal. By using charts, businesses can simplify complex data, making it easier for stakeholders to understand and make informed decisions.
How is the Charts Chapter Used?
The Charts chapter is typically used in a business proposal to provide visual explanations and support to the textual content. It can be used to showcase project timelines, budget allocations, market analysis, and more through various forms of charts such as bar graphs, pie charts, line graphs, and tables. Integrating this chapter into a proposal ensures that data is not only presented but also interpreted in a way that is accessible to all proposal reviewers.
What is Included in the Charts Chapter?
This chapter includes a variety of elements tailored to enhance the presentation and comprehension of data. Primarily, it consists of:
- Introduction: Brief explanation about the relevance of the charts to the project.
- Detailed Descriptions: Each chart comes with a detailed description explaining what the data represents and how it should be interpreted.
- Visual Elements: Various types of charts and graphs that visually represent the data discussed in the proposal.
- Source of Data: Information on where the data for the charts was sourced, which is critical for validating the credibility of the information presented.
Use Case Examples for the Charts Chapter
- General Information: Enhancing sections like executive summaries to quickly showcase company growth or market trends.
- Project Scheduling: Using Gantt charts to illustrate project timelines and phases.
- Financial Documentation: Displaying budget breakdowns and financial forecasts in pie charts or bar graphs.
- Risk Management: Visualizing risk assessment results to highlight potential issues and their impact.
- Appendices: Including supplementary data that supports the proposal's claims or conclusions.
Key Takeaways
- Enhances Clarity: Using the Charts chapter helps in depicting complex data in an easily digestible format.
- Supports Decision-Making: Visual data aids stakeholders in making informed decisions by providing a clear understanding of the information.
- Increases Credibility: Well-presented and accurate charts increase the professionalism and credibility of the proposal.
- Versatile Applications: The chapter can be adapted for various sections of a proposal, making it a tool.
- Comprehensive Detailing: This chapter not only presents data visually but also includes thorough explanations and sources, which enrich the proposal's content.

Illustration of Proposal Pack Symbols #7
 What Our Clients Say
This product has saved us so much time and energy and helped us produce professional extremely high quality proposals that look great. The upgrades are even better and it’s obvious these guys have worked hard to make Proposal Pack Wizard even better and now I don’t even have to hire a graphic designer so it’s saving me even more money. I couldn’t recommend this Pack more highly. Anyone putting out regular documentation, submissions, proposals, etc, would be nuts not to buy it."
Business Development Manager at Morcodian Pty Ltd
Australia
 4.7 stars, based on 842 reviews
Alternate Chapters
Related Chapters

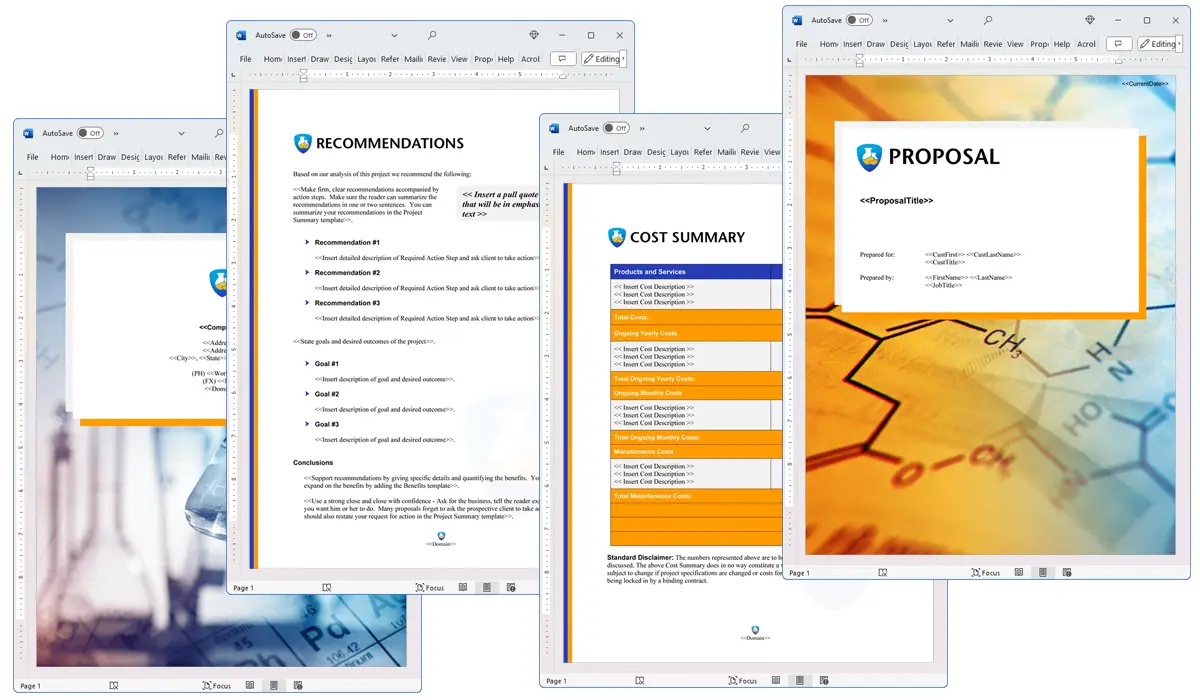
The Charts chapter and other chapters are integrated into a Word document as illustrated here in the Proposal Pack Science #4 design theme. There are hundreds of design themes available, and every design theme includes the Charts chapter template.
A proper business proposal will include multiple chapters. This chapter is just one of many you can build into your proposal. We include the complete fill-in-the-blank template in our Proposal Pack template collections. We also include a library of sample proposals illustrating how companies in different industries, both large and small, have written proposals using our Proposal Packs. This template will show you how to write the Charts.
We include a chapter library for you to build from based on your needs. All proposals are different and have different needs and goals. Pick the chapters from our collection and organize them as needed for your proposal.
Using the Proposal Pack template library, you can create any business proposal, report, study, plan, or document.
 Ian Lauder has been helping businesses write their proposals and contracts for two decades. Ian is the owner and founder of Proposal Kit, one of the original sources of business proposal and contract software products started in 1997.
By Ian Lauder
 Published by Proposal Kit, Inc.


 Cart
Cart
 Facebook
 YouTube
 X
X Search Site